View Activity Logs with CloudWatch
Check Website Activity Logs with CloudWatch
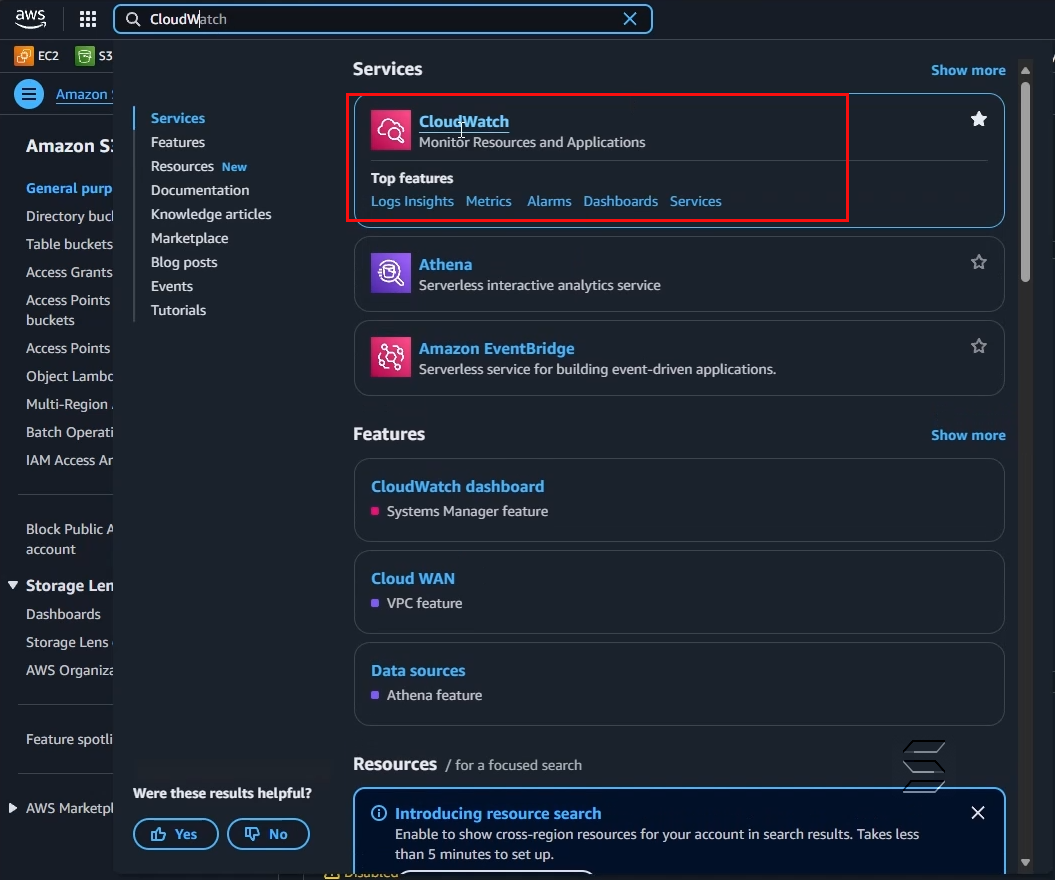
1. Search for and access the CloudWatch service page
- In the search bar, enter: CloudWatch
- The result will be displayed as shown below:
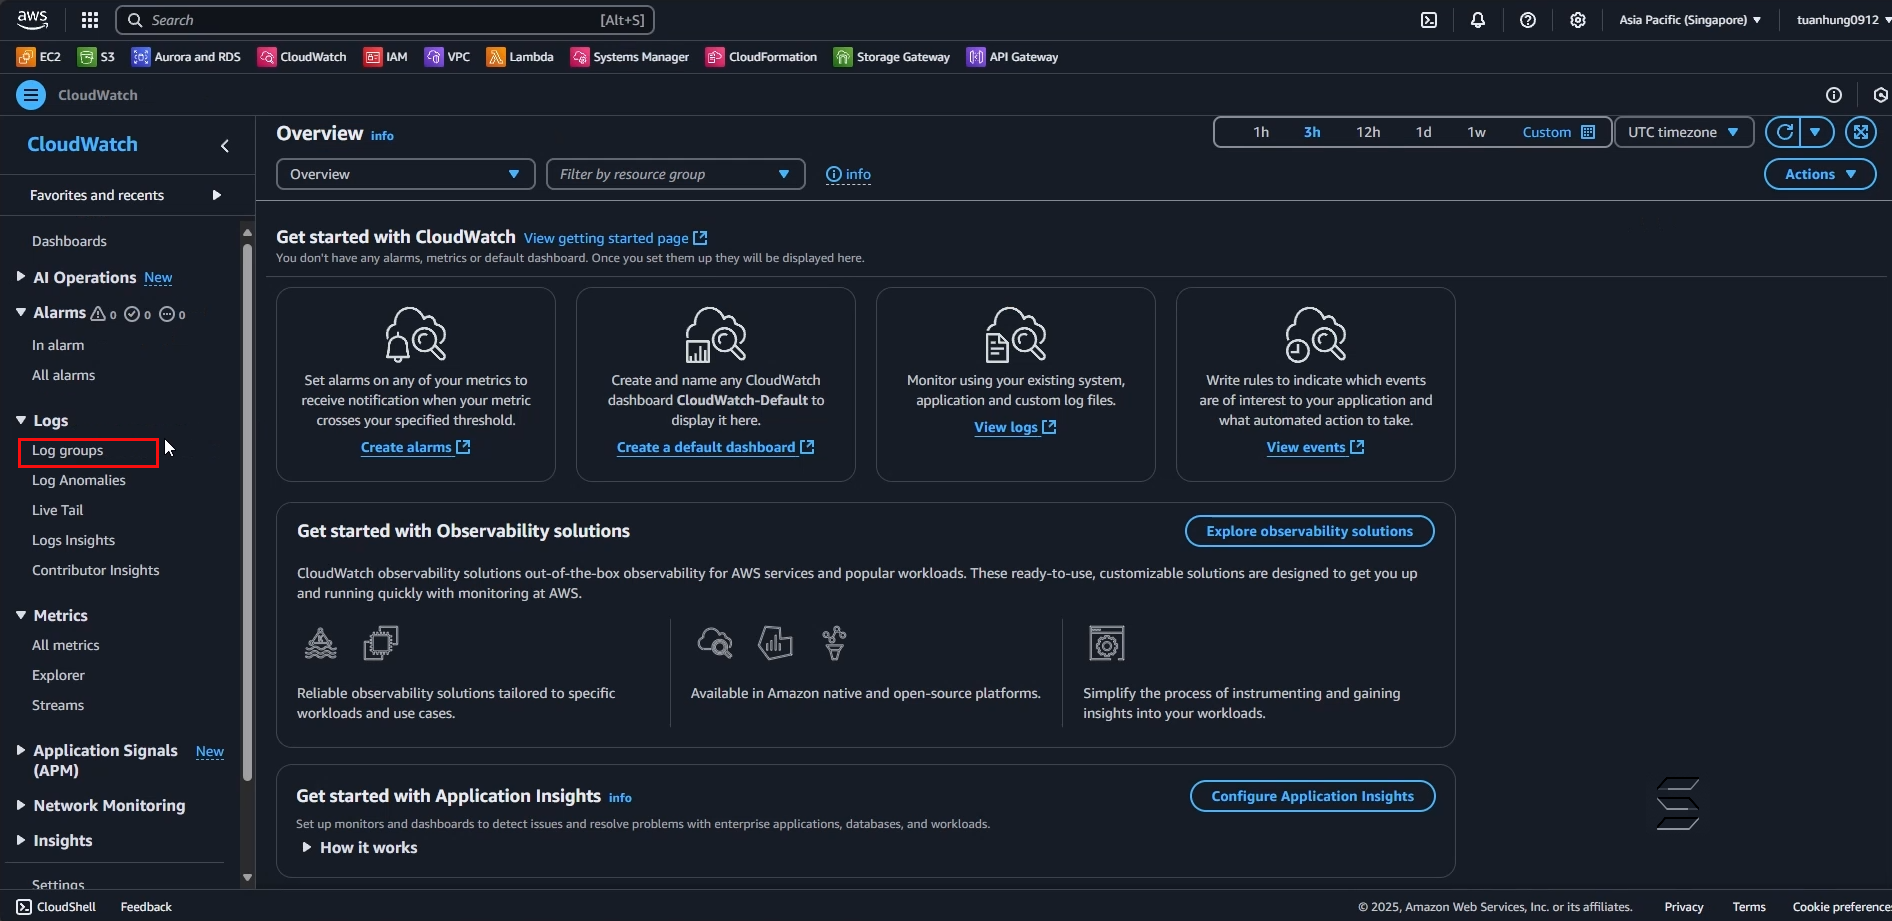
- On the main page of the CloudWatch service
- On the left Navigation Panel, select Log groups
- The result will be displayed as shown below:
2. Check and view activity logs
- On the main Log groups page
- You can see that there are 2 Log groups automatically created after we performed the Analyze Image and Upload Image functions in the previous section
- This is where we can check how the functions operate
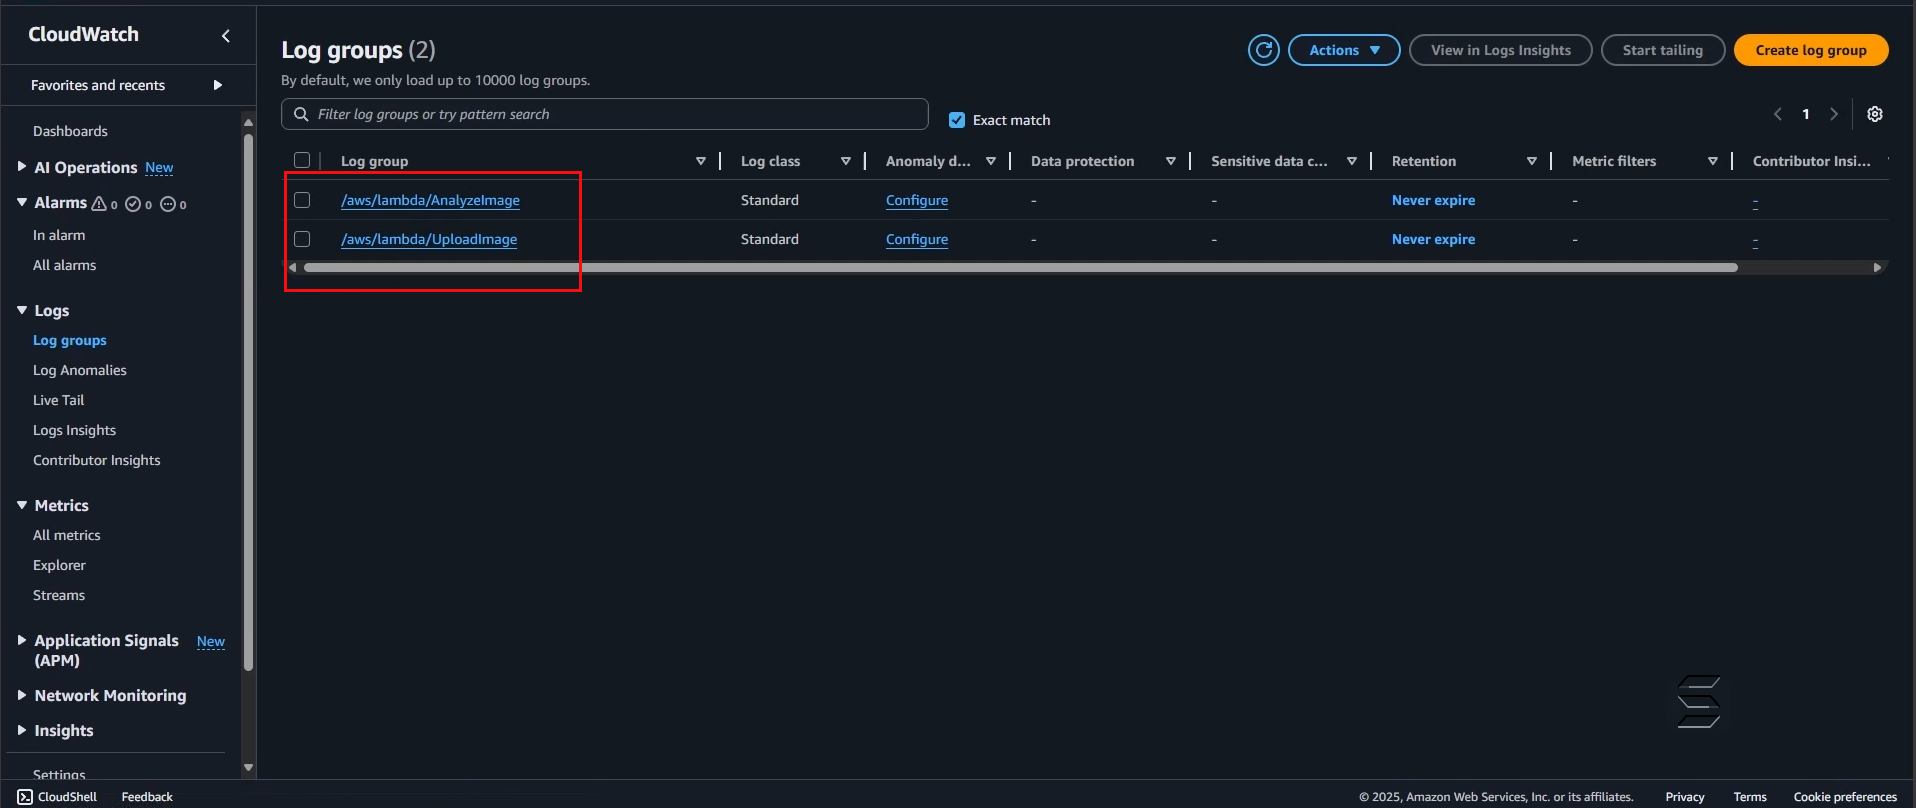
- Select the Log group for the Analyze Image function
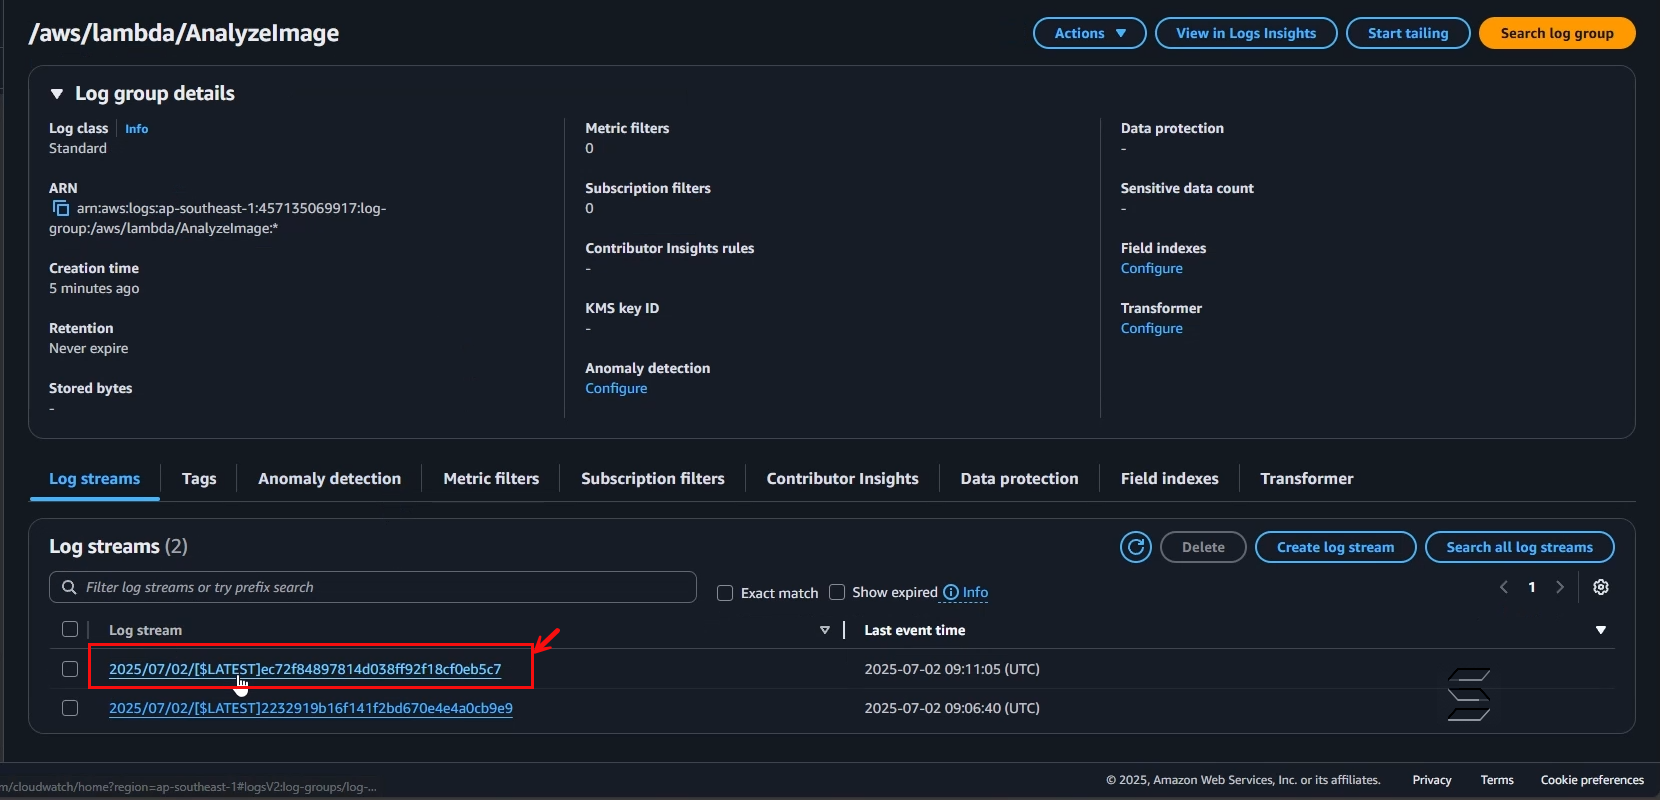
- On the Log group details page for the Analyze Image function
- You can see other detailed information
- Especially Log Streams, these are the main activity streams each time you perform the function; each execution will add a Log Stream to record the detailed activity of that execution
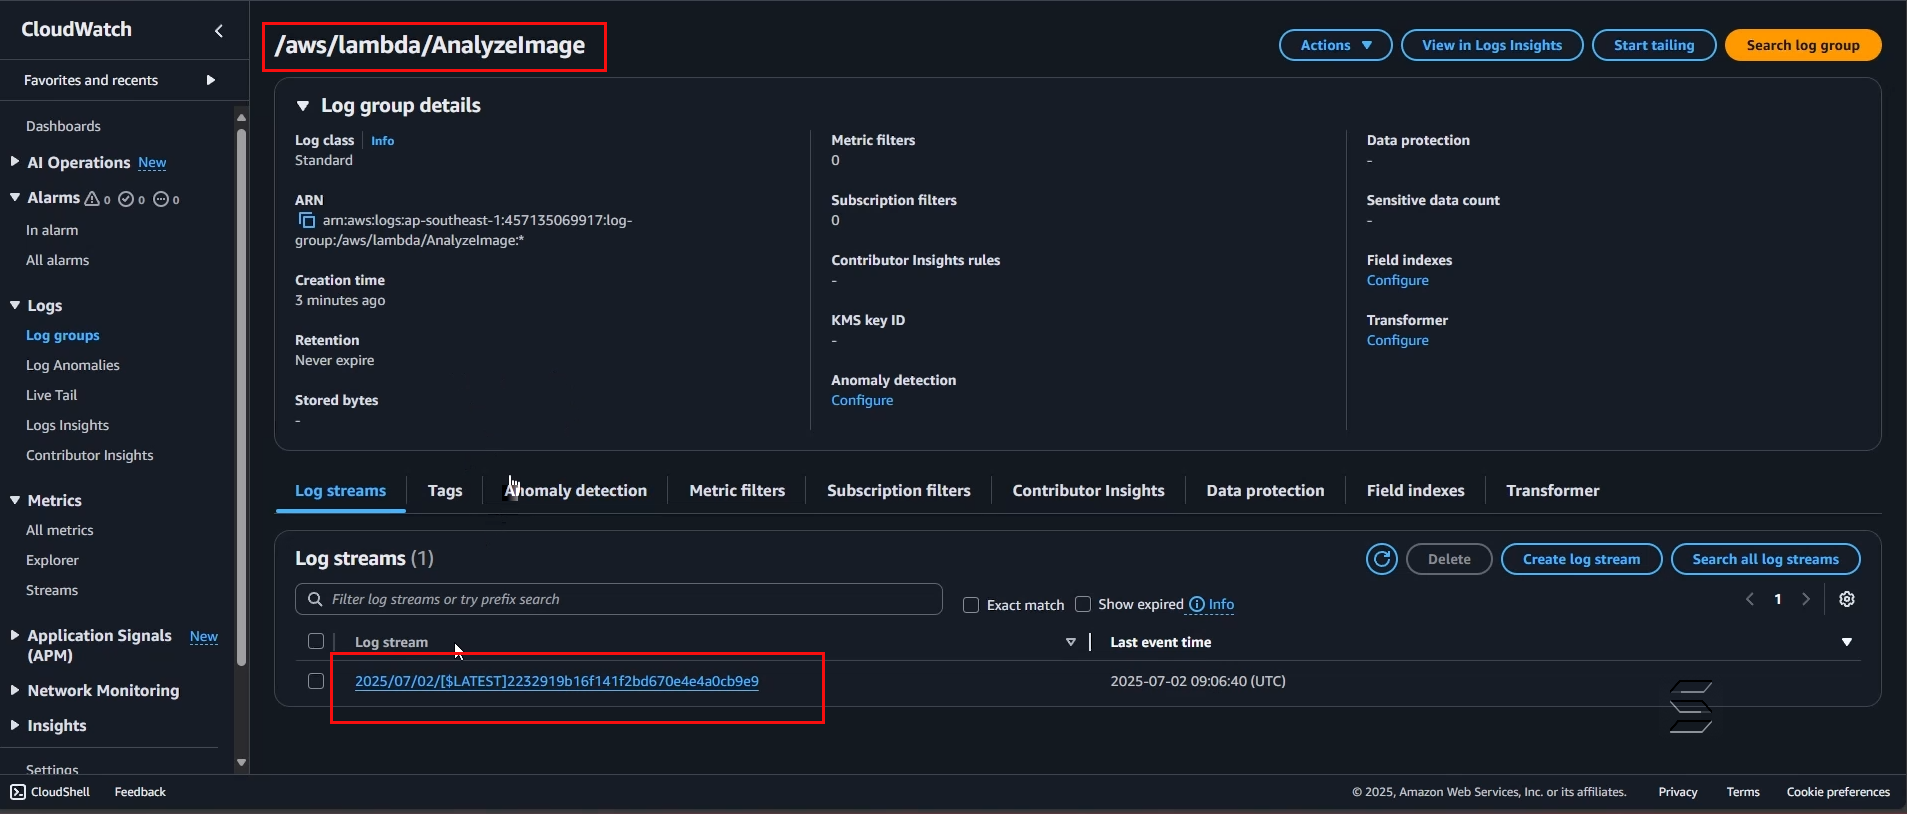
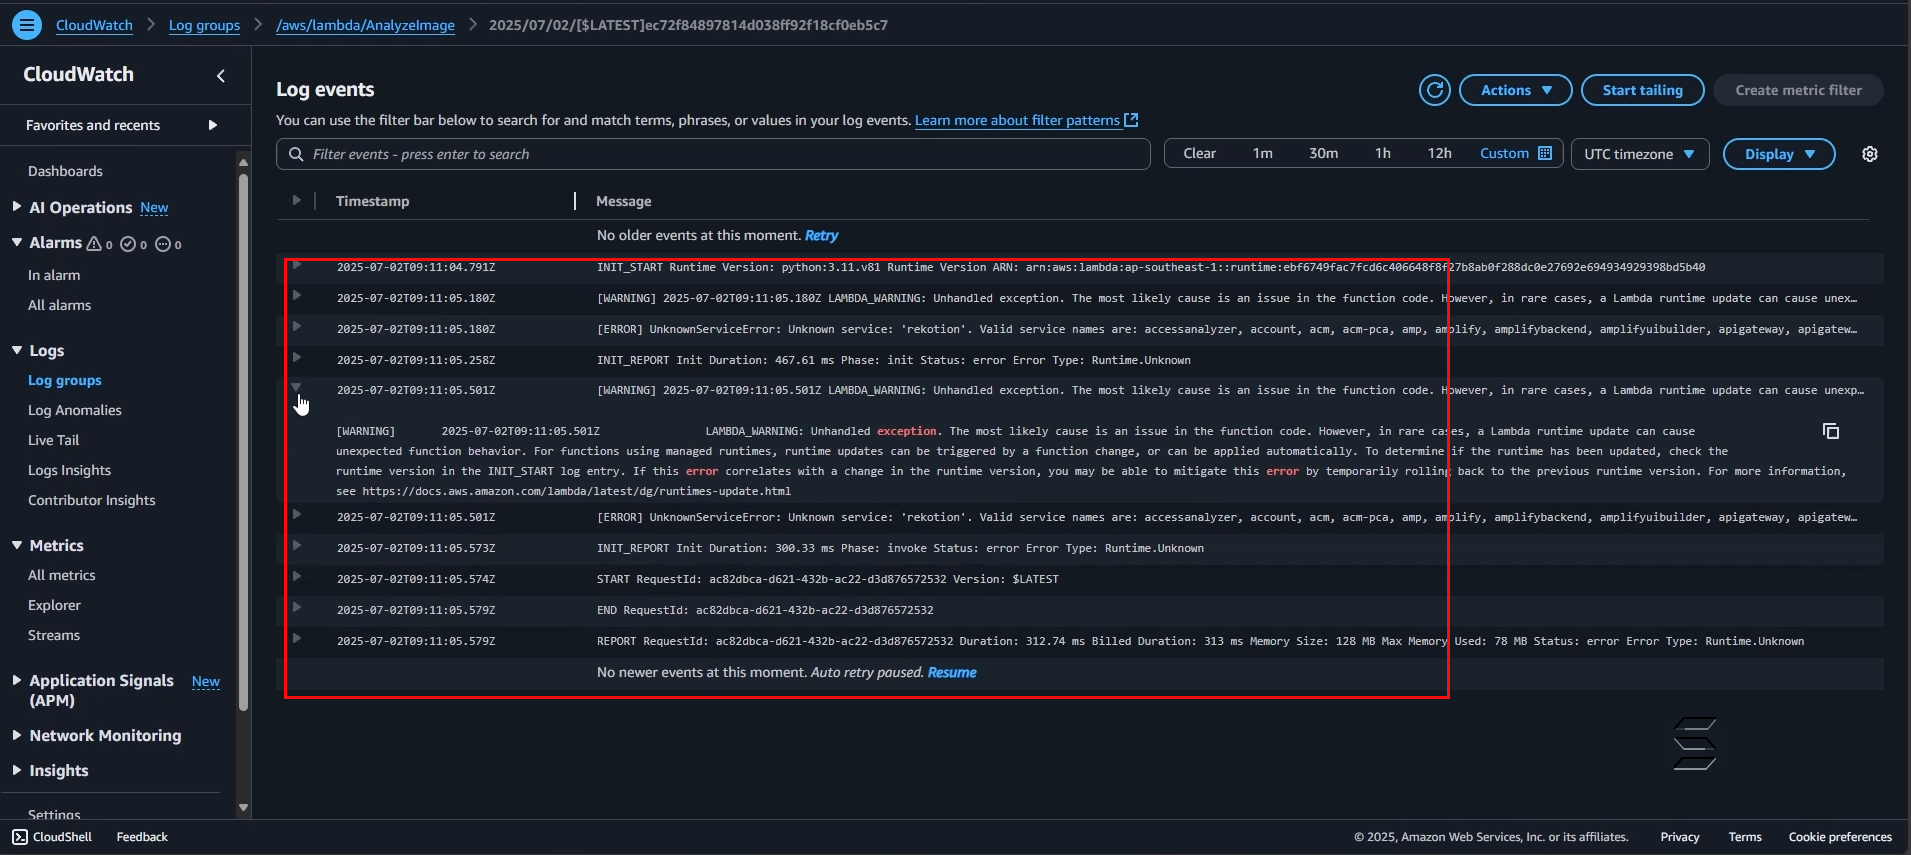
- Here are the details of the Log Streams activity:
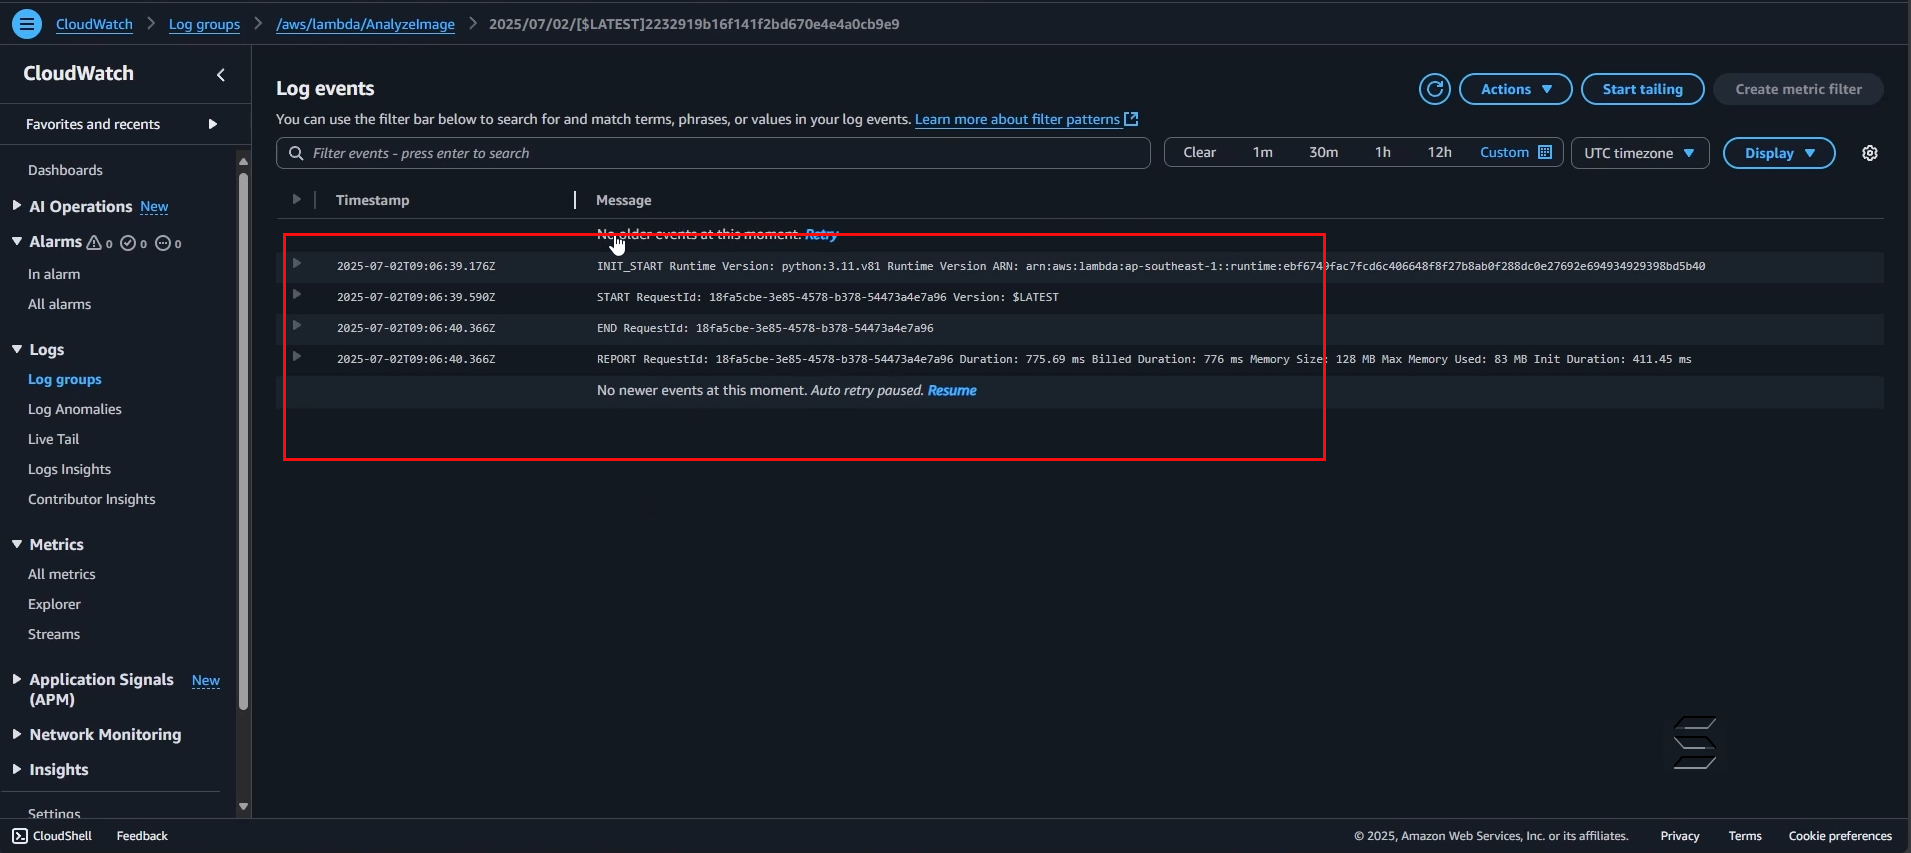
- Let’s try an example where the Analyze Image function encounters an error and check the Log Streams result
- First, go to the Lambda Function for the Analyze Image function
- Then proceed to edit any line of code as follows:
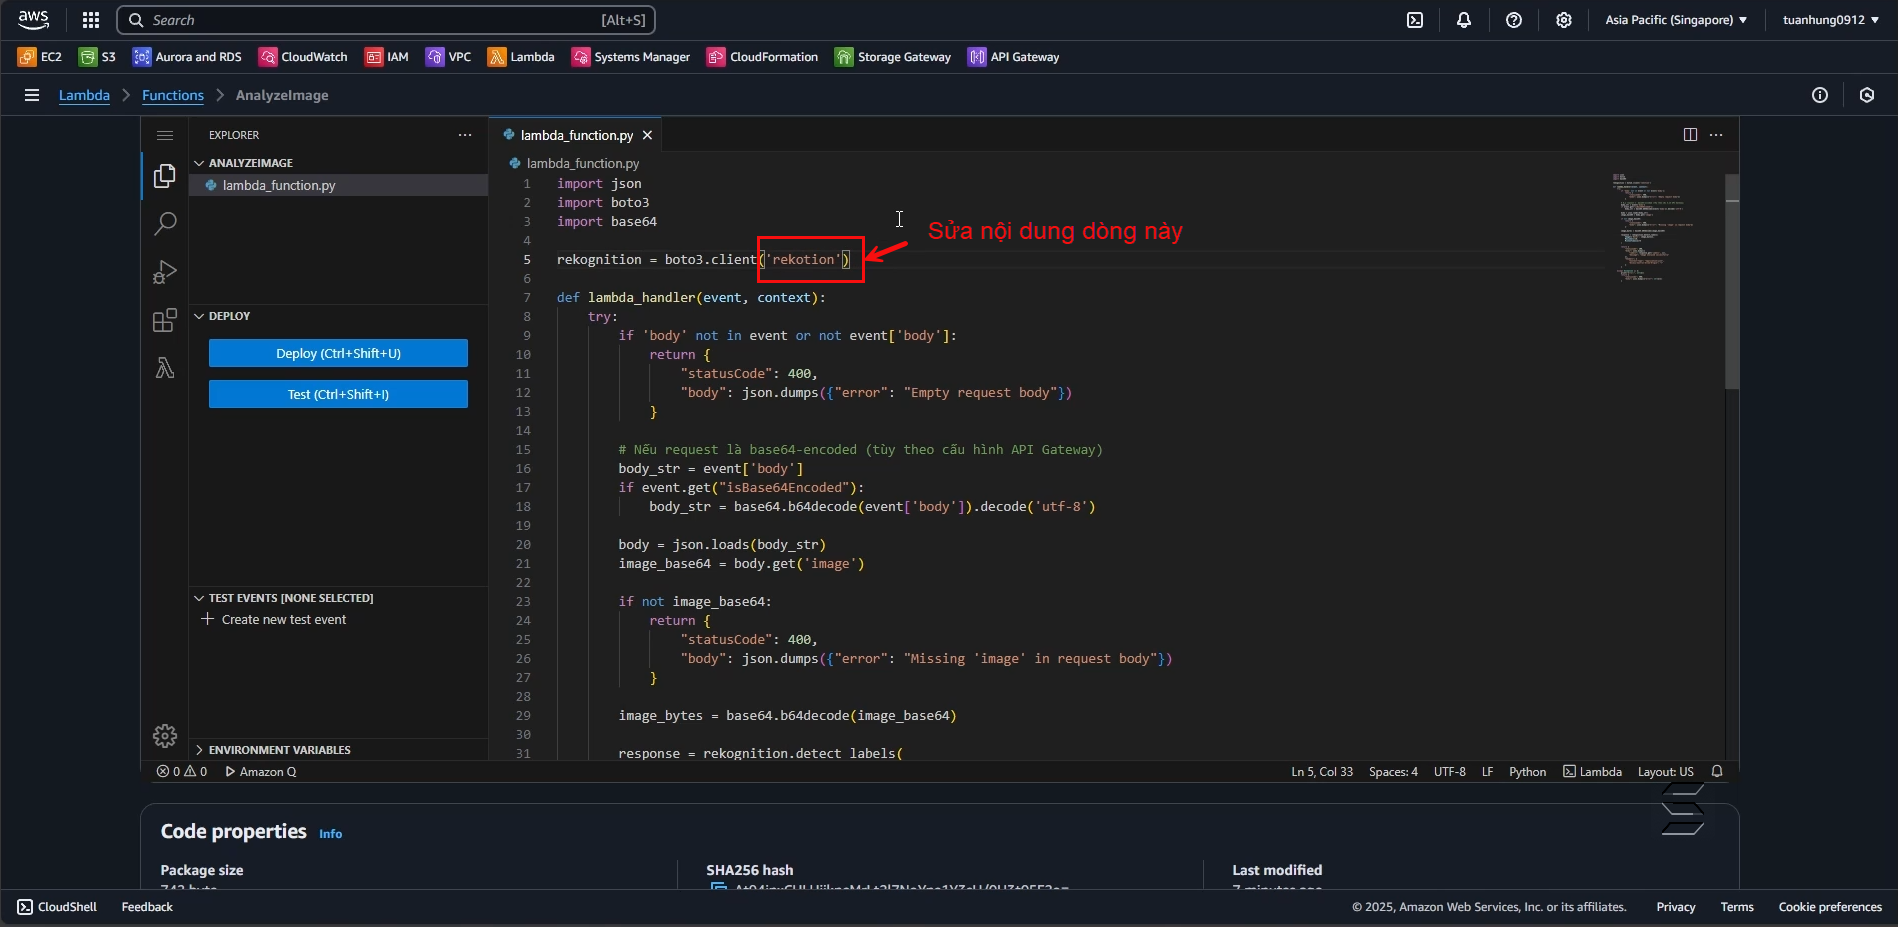
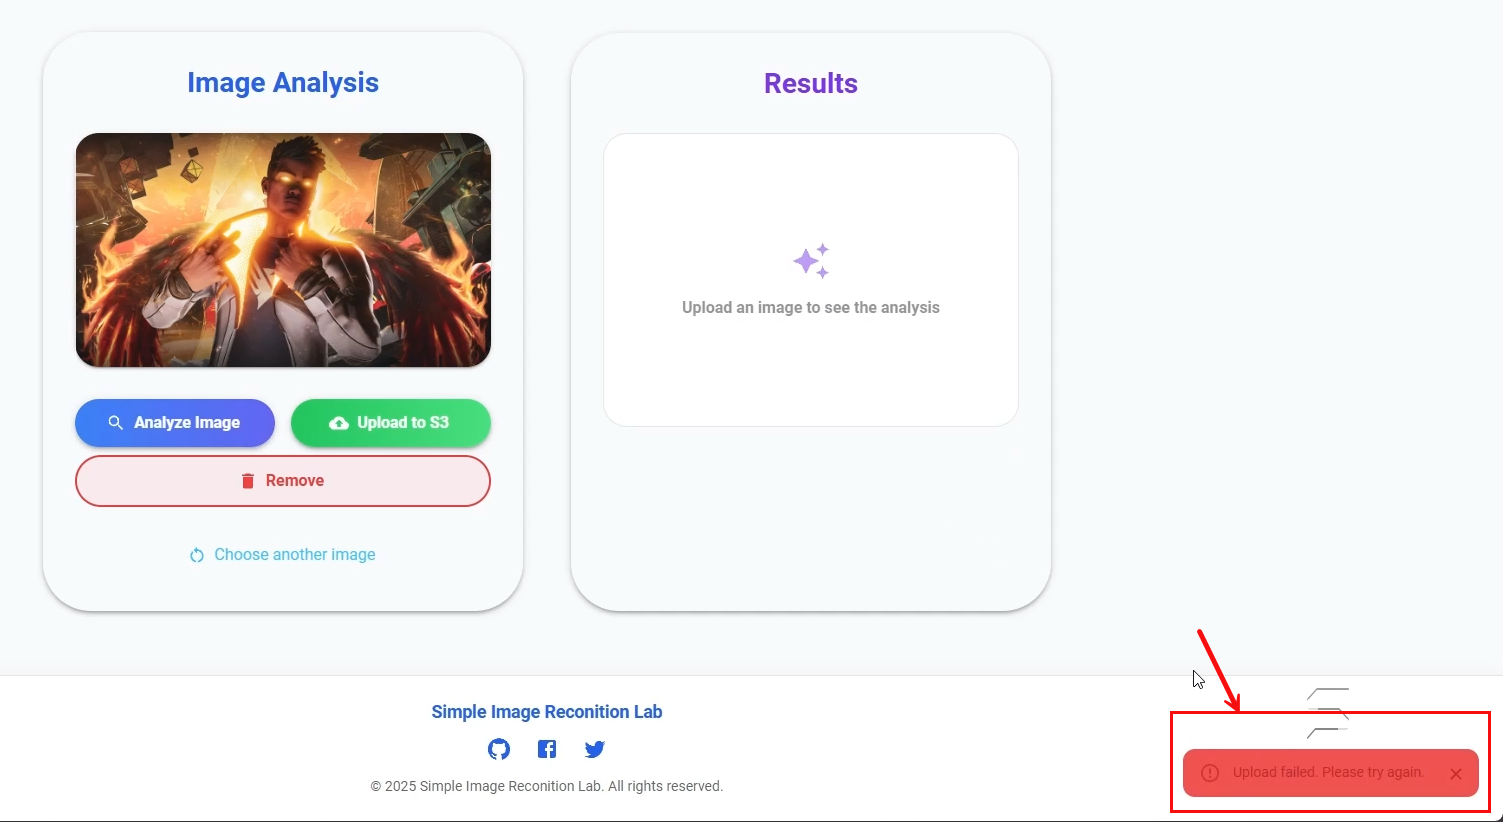
- Explanation: We will edit the line of code as shown above so that the lambda function cannot call the AWS Rekognition service client. The system will then report an error on the Front-End because it cannot perform the image analysis function and will record the error Log Streams as shown in the following images:
Through this section, you can understand how Log groups work in CloudWatch. This service will help you conveniently monitor your application’s activities and easily display all error information, making